data maps
Where would you like to go?
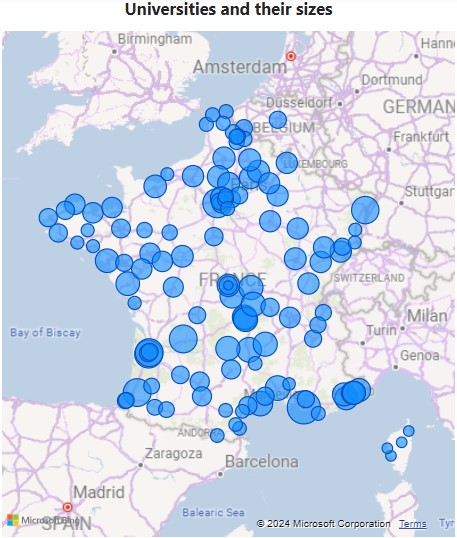
Welcome!
Whether you’re thinking of moving to a new city, or to a new part of the world
you have some idea of where you’d ike to live:
– what kind of weather you want
– what kind of economy you need that supports your career
– do you want an urban or rural lifestyle?
– does it have a sub-culture with the hobbies you like?
– an age demographic you want to be surrounded by?
– a language you can learn (or don’t have to learn)
– attainable visa requirements
Use this site to check off those criteria.
May you find your “home” here.


Moving to France?
One thing people look for when choosing a place to live is its proximity to a bustling university with lots of young people. France has some of the oldest and most respected universities in Europe, and they add vibrancy and innovation to their city.
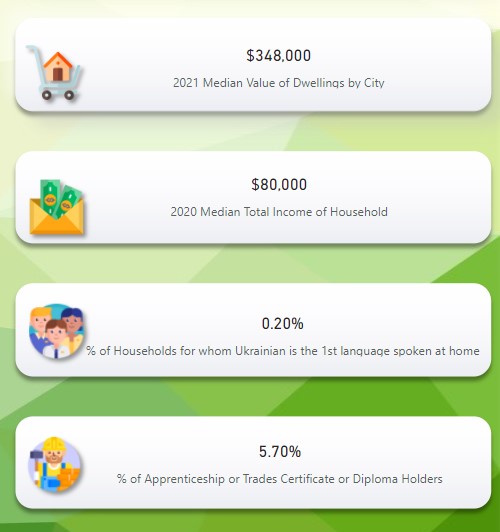
Clickable Demographic Data
Statistics Canada publishes census data every five years, and it truly is an exciting time when you can only get certain information like household income, housing valuations, and rental prices. This image was part of the dashboard I designed for Ukrainian refugees coming to Canada.
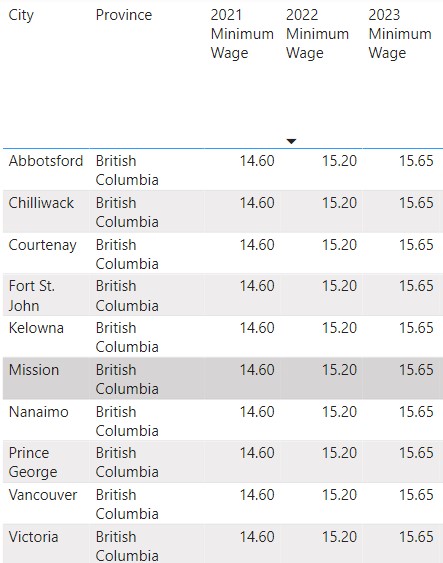
Tables of Data
Cleaning data is a long and tedious process. You can download some ready-made data yourself from certain country pages. The source is always listed.
ABOUT DATAMAPS.CA
When my great-grandparents escaped Russian occupation in Ukraine in 1930, they didn’t know what to bring with them to Canada, so along with their few belongings, they brought an atlas.
When Ukrainians started fleeing the Russian invasion again in 2022 and were coming to Canada, I found myself making maps for them of demographic data to help them decide where to live.
I love making maps and dashboards on Power BI, and I’m currently working toward my Microsoft PL-300 certification.
I hope you get something useful and joyful out of this website, whether it’s finding a new place to live or explore.


TALK TO US
Have any questions? I am always open to discussing your data visualization needs and ideas.